Central Columbia Plateau - Yakima River Basin NAWQA Study -- Publications
USGS Fact Sheet FS-069-98
July 1998
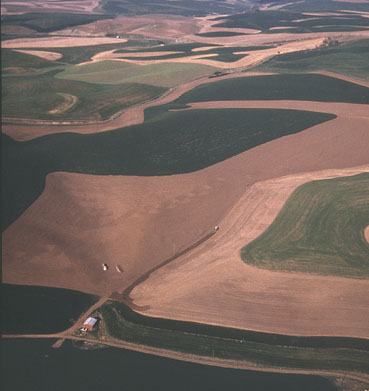
A U.S. Department of Agriculture (USDA) study reported that from 1939 through 1977, the average annual rate of soil erosion in the Palouse River Basin was 9.2 tons per acre (tons/acre) of available cropland, or about 14 tons/acre of cultivated cropland (USDA, 1978). The study concluded that without erosion control practices, the average annual rate of erosion would increase to 14 tons/acre as more cropland was put into production.
Strip-cropping is a widely used erosion control practice in the Palouse River Basin.Innovative farmers and other agriculture professionals have been developing ways to reduce soil erosion in the Palouse River Basin since the 1930s. The first soil conservation district in Washington State was organized by a group of farmers at Palouse in 1940. In 1972, Public Law 92-500 mandated a water-quality management plan for dryland agriculture. The final plan, adopted by the Washington State Department of Ecology in 1979, recommended best management practices to control soil erosion and reduce runoff of nutrients and agricultural chemicals from cropland.
|
Erosion control
practice |
Acres under erosion
control1 |
Predicted average annual
reduction in erosion2 |
|||
|---|---|---|---|---|---|
|
1979
|
1994
|
Tons per
acre |
Total tons 3
|
||
|
No-till seeding
|
600
|
56,000
|
|
500,000
|
|
|
Crop Reserve
Program |
6,400
|
60,600
|
|
270,000
|
|
|
Stripcropping
divided slopes |
0
|
239,000
|
|
240,000
|
|
|
Terraces
|
680
|
4,500
|
|
7,600
|
|
|
Grass water-
ways |
482
|
41,550
|
|
1,500
|
|
|
Planting trees
and shrubs |
0
|
3,670
|
|
37,000
|
|
|
Conservation
tillage |
0
|
81,000
|
|
650,000
|
|
|
Totals3
|
7,680
|
445,000
|
1,700,000
|
||
Until 1981, soil erosion rates were estimated annually; currently they are estimated every five years (USDA, 1988). When estimates are not available, sediment data can be used to infer trends in erosion. For example, comparing historical with recent year-to-year variations in annual average concentrations* of suspended sediment in the Palouse River reveals that the average concentration for the years 1993-96 is one-half the average for the years 1962-71 (fig. 3). These data are in general agreement with model results that indicate reduced erosion from fields during recent years (see table). However, the difference in annual averages of suspended sediment is explained partially by a skewed average for 1962-71 that resulted from a large storm in February 1963 (fig. 4). Frozen ground and other conditions that preceded this storm caused extremely high erosion rates (Boucher 1970), and these conditions did not occur in 1993-96.
Figure 3.Comparing the historical record (1962-71) to recent
years (1993-96) shows a decrease in the average annual concentration of
suspended sediment in the Palouse River at Hooper.
![]()
Figure 4.At the Palouse River at Hooper, highest average
concentrations of suspended sediment were observed during 1962-71 storms.
*These annual average concentrations were computed by dividing annual sediment loads by annual water discharge at the Palouse River at Hooper.
Boucher, P.R., 1970, Sediment transport by streams in the Palouse River basin, Washington and Idaho: U.S. Geological Survey Water Supply Paper 1899-C, 37 p.
Kaiser, V.G., 1967, Soil erosion and wheat yields in Whitman County, Washington: Northwest Science, v. 41, no. 2, p. 86-91.
Pimentel, David, Harvey, C., Resosudarmo, P., Sinclair, K., Kurz, D., McNair, M., Crist, S., Shpritz, L., Fitton, L., Saffouri, R., and Blair, R., 1995, Environmental and economic costs of soil erosion and conservation benefits: Science, v. 267, p. 1117-1123.
Renard, K.G., Foster, G.R., Weesies, G.A., McCool, D.K., and Yoder, D.C., 1997, Predicting soil erosion by water: a guide to conservation planning with the revised universal soil loss equation (RUSLE): U.S. Department of Agriculture, 384 p.
U.S. Department of Agriculture, Economics, Statistics, and Cooperatives Service, Forest Service, and Soil Conservation Service, 1978, Palouse co-operative river basin study: U.S. Department of Agriculture, 182 p.
U.S. Department of Agriculture Soil Conservation Service, 1988, Washington's soil and water--conditions and trends 1982-1987: Spokane, Wash., U.S. Department of Agriculture, 12 p.
U.S. Geological Survey, 1962-1971, Water resources data for Washington: Tacoma, Washington, annual tabulation for years indicated.
Wischmeier, W.H., and Smith, D.D., 1978, Predicting rainfall erosion losses--A guide to conservation planning: U.S. Department of Agriculture Handbook No. 357, 58 p.
Acknowledgments: Data collection; production of daily sediment records: Brett Smith; Editorial review: Martha Erwin
For further information
contact:
Project Chief, Central
Columbia Plateau NAWQA
1201 Pacific Ave. Suite
600
Tacoma, WA 98402
(253) 428-3600
send
Email to rwblack@usgs.gov
http://wa.water.usgs.gov/ccpt/
R. Dennis Roe, U.S.
Department of Agriculture
805 Vista Point Drive
Colfax, WA 99111
(509) 397-4636
send
Email to rdroe@wsu.edu
This fact sheet and data collected in the 1990s is part of the National Water-Quality Assessment (NAWQA) program of the U.S. Geological Survey, which is designed to describe current water-quality conditions for a large part of the Nation's ground and surface water, to describe how water quality is changing over time, and to improve our understanding of the natural and human factors that affect our water quality.
Suggested citation:
Ebbert, James C., and Roe, R. Dennis, 1998, Soil erosion in the Palouse River Basin: Indications of improvement: U.S. Geological Survey Fact Sheet FS-069-98, on line at URL http://wa.water.usgs.gov/ccpt/pubs/fs.069-98.html, accessed [date of access].
For a paper copy of this report, sendEmail to nawqa_ccpt_wa@usgs.gov
Central Columbia Plateau - Yakima
River Basin NAWQA Study
National Water-Quality Assessment Program || NAWQA Program bibliography
Water Resources of Washington
State || U.S. Geological Survey
This page is http://
wa.water.usgs.gov
/pubs/fs/fs069-98/index.htm
Maintained by Sarah J. Ryker [ sjryker@usgs.gov]