
Assessing Ground-Water Vulnerability Using Logistic Regression
Anthony J. Tesoriero, Emily L. Inkpen and Frank D. Voss
Water Resources Division, U.S. Geological Survey
1201 Pacific Avenue, Suite 600
Tacoma, WA 98402
in Proceedings for the Source Water Assessment and Protection 98 Conference, Dallas, TX, p. 157-165.
Abstract
Determining the likelihood that ground water contains elevated concentrations of contaminants can help water resource managers protect drinking water supplies. For example, this information is useful for selecting new sites for drinking water sources and designing more cost-effective monitoring strategies for existing sources. Ground-water vulnerability has typically been assessed using largely qualitative methods and expressed as relative measures of risk. In this study, a statistical approach was used to quantify the likelihood that a well contains an elevated concentration of nitrate or a detectable concentration of atrazine.
The occurrence of elevated nitrate concentrations or detectable concentrations of atrazine in ground water was related to both natural and anthropogenic variables using logistic regression. The variables that best explain the occurrence of elevated nitrate concentrations were well depth, surficial geology, and the percentages of urban and agricultural land within a radius of 3.2 kilometers of a well. Well depth and roadside application of atrazine best explained the occurrence of detectable concentrations of atrazine. From these relations, multiple logistic regression models were developed which predict the probability that a well has an elevated nitrate concentration or a detectable concentration of atrazine.
Introduction
Numerous approaches have been developed to assess ground-water vulnerability and can be divided into three major categories: overlay and index methods, process-based methods, and statistical methods [1]. The type of method chosen for vulnerability assessment will depend on factors such as the scale of the study area, data availability, and the specific results desired.
Overlay and index methods combine maps of physiographic attributes such as depth to the water table, ground-water recharge rate, and soil and aquifer material properties. Each attribute is weighted using expert opinion of the relative importance of that attribute to ground-water vulnerability in that area. Study areas for overlay and index methods are typically large in scale, commonly statewide. Although these methods are simple and use readily available data, they rely heavily on qualitative judgment for both the parameters chosen and their relative weights.
Process-based methods attempt to predict contaminant transport in both space and time. These methods require analytical or numerical solutions to mathematical equations that represent coupled processes governing contaminant transport. Although process-based methods are more sophisticated than the overlay and index methods, the results are not necessarily more accurate [1]. Required data commonly must be indirectly estimated or extrapolated from other data, which can introduce large error into the models. The more complex, multivariable models are usually developed for small study areas.
Statistical methods for assessing ground-water vulnerability relate the occurrence of constituents in ground water to explanatory variables. These variables describe either potential sources of these constituents or the relative ease with which it may migrate to the position in the flow system where the ground water sample is taken. Several statistical methods have been used to relate water quality data to explanatory variables, including logistic regression and tobit [2,3]. The output from these models is commonly given as a probability that a well will contain a certain constituent, allowing risk comparisons in space and time (e.g., which areas have a higher risk of contamination; how these risks are changing with time). Due to the statistical advantages of large sample sizes, these models are usually developed at regional scales.
In this report, results from logistic regression analysis are presented which relate the occurrence of elevated nitrate (NO3-) concentrations and the detection of atrazine to natural and anthropogenic variables in the Puget Sound Basin. From these relations, the probability that ground water will contain these constituents is predicted. This process provides a better understanding of the sources and natural conditions that affect the risk of contamination by nitrate and atrazine.
Methods
Data from the Washington State Department of Health (WDOH) and the U.S. Geological Survey's National Water Quality Assessment (NAWQA) program were used to relate the occurrence of elevated nitrate concentrations and atrazine to natural and anthropogenic variables. The WDOH requires public drinking water suppliers to periodically monitor the quality of their water. In a recent paper [4], a vulnerability assessment was performed by using logistic regression on nitrate data from 1,814 wells in the WDOH data set. This paper summarizes the findings from this work followed by the application of this method to atrazine data collected by the NAWQA program. The NAWQA program is collecting water quality data for nitrate, pesticides, and volatile organic compounds for the purposes of assessing the status of and trends in the Nation’s water quality as well as the causes of adverse impacts on water quality.
Logistic regression was chosen because it can (1) analyze data sets which have large numbers of censored values (more than 50% of values for nitrate and atrazine in the WDOH and NAWQA data sets are reported as non-detections at the specified reporting level), and (2) help identify relations between water quality and explanatory variables. The form of the logistic regression model is:
where P is the probability that the constituent of interest is present at a concentration above a specified level, X is a vector of n explanatory variable values, b0 is a scalar intercept parameter, and b is a vector of slope coefficient values, so that bX = b1X1 + b2X2 +......bnXn.
Several statistics are provided to evaluate model performance. A significant p-value (e.g., p less than or equal to 0.05) for the Wald statistic is evidence that a regression coefficient is nonzero. For a given set of data, the Akaike's Information Criteria (AIC) is a goodness-of-fit measure; lower values indicate a better fit. The Hosmer-Lemeshow goodness-of-fit statistic (HL) is based on grouping the data by the values of estimated probabilities. Each group is termed one decile of risk if 10 equal-sized groups are formed (e.g., the 10% of the wells with the highest predicted probabilities that a constituent is above the specified level form one decile of risk). Within each group the frequency of events (concentration above the specified level) and nonevents (concentration below the specified level) predicted by the model is compared to the frequency observed. Lower HL values indicate a better fit between observed and predicted outcomes. The null hypothesis for the HL test is that the model fits the data. High p-values for the HL test indicate that the null hypothesis should not be rejected. More detailed information on logistic regression and the above-mentioned measures of model performance is available elsewhere [5].
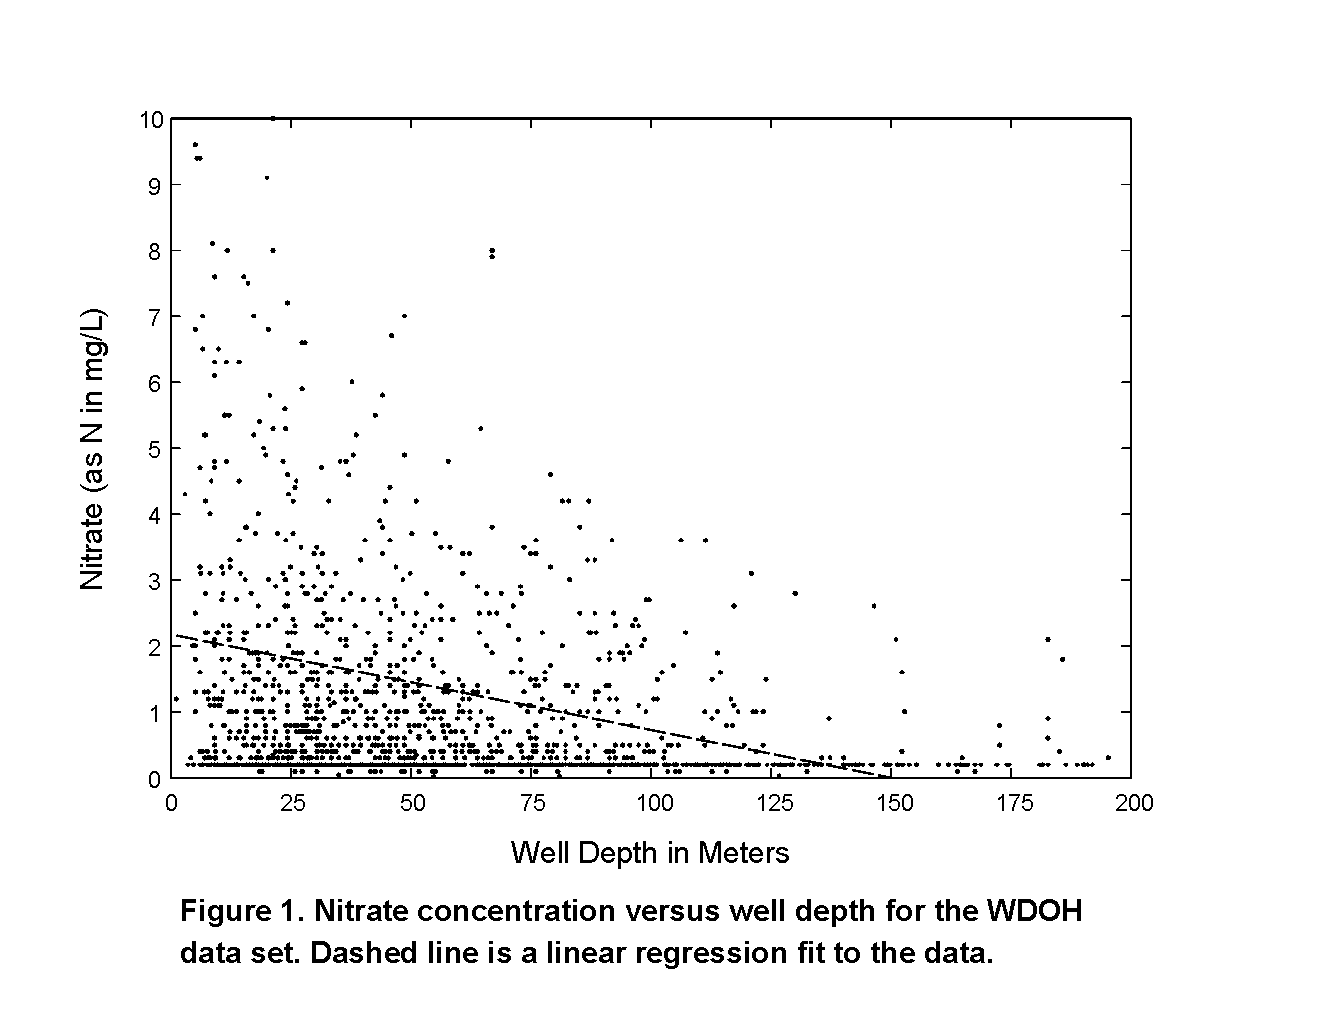
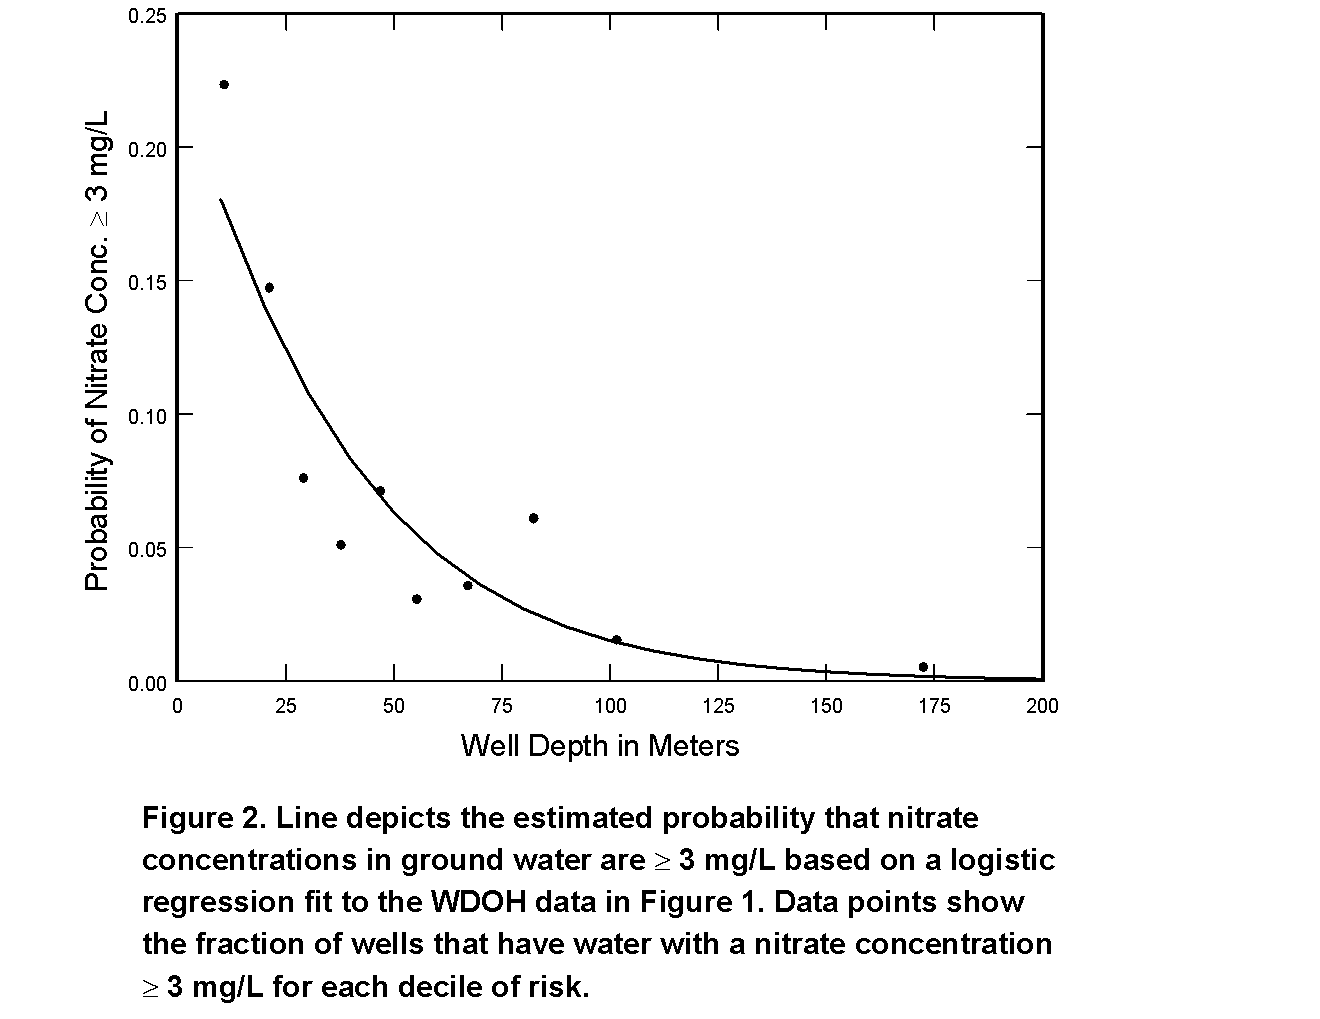
Logistic regression may identify relations between the occurrence of a constituent and explanatory variables when other methods do not because logistic regression answers a simpler question - whether a well is expected to have water with a concentration greater than a specified value. In contrast, other methods (e.g., linear regression) try to estimate the absolute concentration of a constituent. Given the many factors related to the source and transport of a constituent in ground water, it is often impossible to predict its concentration; however, it may be possible to predict the probability that the concentration is above a specified level. For example, for the WDOH nitrate data, no satisfactory linear regression models could be developed when nitrate concentrations were related to explanatory variables (r2< 0.1, p>0.05). However, when nitrate concentrations were converted to a binary variable (< 3 milligrams per liter (mg/L) or ³ 3 mg/L), significant relations (p£ 0.05) were found for many variables. One such relation is illustrated graphically by comparing a plot of nitrate concentration versus well depth (Figure 1) with a plot of predicted probability of ground water having a nitrate concentration ³ 3 mg/L versus well depth (Figure 2).
Data Analysis and Discussion
Nitrate
A model that estimates the likelihood that a well in the Puget Sound Basin contains elevated nitrate concentrations (³ 3 mg/L) was recently developed by relating the occurrence of elevated nitrate concentrations to natural and anthropogenic factors using logistic regression [4]. Well depth, surficial geology, and land use within a 3.2-kilometer (km) radius of a well were found to be significant (p£ 0.05, Table 1); a radius of 3.2 km was selected to describe land use because this radius provided the best fit to the data. Percent urban and agricultural land have positive coefficients, suggesting sources of nitrate from both environments are responsible for elevated nitrate concentrations. Possible urban sources of nitrate include lawn fertilizers and high density septic systems; agricultural sources include land application of animal manure and crop fertilizers.
Table 1. Regression coefficients and summary statistics for single variable models developed using nitrate data from the Washington State Department of Health (from Tesoriero and Voss [4]). b0 is the intercept parameter and b1 is the regression coefficient as described in equation 1. In parentheses after each b1 value is the p-value for the Wald statistic. AIC is the Akaike's Information Criteria. Sample size is 1,814 for all models.
|
Model Variable |
b0 |
b1 |
AIC |
|
Well depth (m) |
-1.29 |
-0.027(<0.01) |
860.2 |
|
Surficial Geology Types |
|||
|
Coarse-grained glacial |
-3.15 |
1.127(<0.01) |
897.9 |
|
Fine-grained glacial |
-2.21 |
-0.878(<0.01) |
913.3 |
|
Alluvium |
-2.50 |
-0.958(0.02) |
927.9 |
|
Land Use Types |
|||
|
% Agricult. within 3.2 km of well |
-3.07 |
0.033(<0.01) |
873.8 |
|
% Forest within 3.2 km of well |
-1.72 |
-0.018(<0.01) |
913.0 |
|
% Urban within 3.2 km of well |
-2.88 |
0.013(<0.01) |
925.6 |
Stepwise logistic regression was used to create a multiple variable model which predicts the probability of elevated nitrate concentrations in order to assess ground-water vulnerability to nitrate in the Puget Sound Basin. In stepwise logistic regression the most significant variables are entered first but only if the desired significance level (p£ 0.1) is met. This process is continued until none of the remaining variables meet this significance level. Separate models were developed for each surficial geology type because each type had a different relation between elevated nitrate concentrations and well depth [4]. Well depth, percent urban land within 3.2 km, and percent agricultural land within 3.2 km were the variables incorporated into the models; regression coefficients and summary statistics for these models are shown in Table 2. The probability that a well in the Puget Sound Basin has an elevated nitrate concentration can be predicted by inserting the coefficient values for the appropriate surficial geology type shown in Table 2 along with information on land use and well depth into equation 1. Maps depicting the probability of elevated nitrate for any well depth can be produced.
Table 2. Regression coefficients and fit information for nitrate and atrazine multiple variable models developed from Washington State Department of Health data and National Water Quality Assessment program data, respectively. b0 is the intercept parameter and b1 through b4 are the regression coefficient values corresponding to equation 1. Dashed line indicates variable was not entered into the model. In parentheses below each coefficient value is the p-value for the Wald statistic. HL is the Hosmer-Lemeshow goodness-of-fit statistic; p(HL) is the associated p-value for this statistic. See text for details.
                                                               Atrazine
                              Nitrate Models                   Model
                  -------------------------------------
Model Variable  Coarse-grained  Fine-grained  Alluvium
                  glacial         glacial

                (720 wells)     (899 wells)   (196 wells)    (151 wells)


 b0, intercept         -2.07       -2.66       -1.95          -1.06

 b1, well              -0.028      -0.016      -0.268         -0.069
    depth (m)         (<0.01)     (<0.01)      (0.05)        (<0.01)

 b2, % agricult.        0.034        ---        0.059           --
 land within 3.2      (<0.01)                 (<0.01)
 km of well

 b3, % urban            0.029       0.023       0.049           --
 land within 3.2      (<0.01)     (<0.01)      (0.10)
 km of well

 b4, roadside           --           --          --            1.94
 atrazine                                                    (<0.01)
 loading
 (kg/km2-yr)


 Goodness-of-fit
 statistics

 HL                    1.6          5.3        1.0             5.9

 p(HL)                 0.99         0.72       0.96            0.66
The accuracy of model predictions was assessed using the HL statistic (Table 2). HL values for all three models are low, suggesting the models fit the data well. Moreover, the p-values for the HL statistic are very high; therefore, the null hypothesis that the models provide a good fit to the data cannot be rejected. The expected and observed number of wells having water with elevated nitrate concentrations compare favorably for each group in the coarse-grained glacial model (Table 3). Similarly, the expected number of wells with water having nitrate concentrations < 3 mg/L closely approximates the observed number.
Table 3. Observed and expected number of wells with water having a nitrate concentration ([NO3-])> 3 mg/L for wells in the coarse-grained glacial deposits. Expected number of wells is determined from the logistic regression fit shown in Table 2. Observed and expected frequencies are also shown for [NO3- ]< 3 mg/L.
|
|
[NO3- ]> 3 mg/L |
[NO3-]< 3 mg/L |
||
|
Group |
Observed |
Expected |
Observed |
Expected |
|
1 |
1 |
0.5 |
72 |
72.5 |
|
2 |
2 |
1.4 |
70 |
70.6 |
|
3 |
2 |
2.3 |
70 |
70.0 |
|
4 |
3 |
3.3 |
69 |
68.7 |
|
5 |
4 |
4.4 |
68 |
67.7 |
|
6 |
5 |
5.7 |
67 |
66.3 |
|
7 |
7 |
7.4 |
65 |
64.6 |
|
8 |
8 |
9.6 |
64 |
62.4 |
|
9 |
16 |
15.1 |
56 |
56.9 |
|
10 |
36 |
34.2 |
34 |
35.8 |
Atrazine
As part of the NAWQA program, ground-water samples have been collected from 151 wells in the Puget Sound Basin and analyzed for an extensive list of pesticides at low reporting levels (the minimum reporting level for atrazine is 0.001 m g/L). Atrazine was the most frequently detected pesticide and was found in 15% of the wells tested. Atrazine was also the most frequently detected pesticide nationally [6]. As with nitrate, logistic regression was used to relate the detection of atrazine to natural and anthropogenic variables to evaluate which sources may be responsible for the presence of atrazine in ground water and to determine which wells are more likely to have water with detectable levels of this herbicide.
A mid-1980s survey [7] identified two major uses of atrazine in the Puget Sound Basin (in kilograms applied per year, kg/yr): roadside applications (11,700) and agricultural usage (4,600). These two sources represent 98% of the estimated usage of atrazine in the basin during the time period of the survey.
Atrazine loading as a result of agricultural usage was approximated by apportioning the county-level application data provided by Tetra Tech [7] equally to agricultural lands in each county as defined by the GIRAS land use coverage [8]. Atrazine loadings within a 3.2-km radius were summed to provide a total loading value for each well (in kg/yr). This radius was selected based on previous work on land use impacts on nitrate concentrations in ground water [4]. This method of describing agricultural usage of atrazine requires assuming that atrazine is applied equally to all crop types. Although this is clearly not the case, more detailed information on crop type is not available at this scale.
Atrazine loading as a result of roadside applications was approximated by summing the estimated yearly amount of atrazine applied by county transportation departments and the Washington State Department of Transportation in each county [7]. These values then were divided by total county area to obtain roadside loading values (in kg/km2-yr). Additional information on the proximity of these applications to the wells (e.g., distance from well to a road where atrazine was applied) is not available.
Atrazine loading from agricultural and roadside sources, land use, well depth, and surficial geology deposits were related to atrazine detection in ground water (Table 4). Significant variables (p less than or equal to 0.05) were well depth and roadside loading. The positive relation between atrazine detection and percent urban land within 3.2 km of a well may be due to roadside loading; roadside loading was positively correlated with percent urban land within 3.2 km of a well (r=0.42, p<0.001). Agricultural loading and percent agricultural land coefficients for predicting detections of atrazine were not significant (Table 4, p=0.89), suggesting that agricultural usage was not the source of most of the detections of atrazine. However, because atrazine application in this basin is limited to certain crops, combining all agricultural loading and agricultural land may have caused sources to be missed (e.g., areas with a high density of crops where large amounts of atrazine may be used, such as corn).
As with nitrate, ground-water vulnerability to atrazine was estimated using stepwise logistic regression: well depth and roadside loading were included in the model (Table 2). An AIC value of 104 was calculated for this model, which is an improvement when compared to the single variable models for atrazine (Table 4). A HL value of 5.9 and p-value of 0.66 suggest that the model provides a reasonably good fit to the data. The expected and observed number of wells having water with detectable concentrations of atrazine are shown in Table 5. Although the fit is generally good, it should be noted that the expected frequencies of many of the groups are low, which may affect the accuracy of the HL test [5]. More detailed roadside application data and crop-specific application rates are likely to greatly improve the accuracy and utility of model predictions.
Table 4. Regression coefficients and summary statistics for single variable models developed using atrazine data from the National Water Quality Assessment program. b0 is the intercept parameter and b1 is the regression coefficient as described in equation 1. In parentheses after each b1 value is the p-value for the Wald statistic. AIC is the Akaike's Information Criteria.
|
Model variable |
Sample sizea |
b0 |
b1 |
AIC |
|
Well depth (m) |
151 |
-0.61 |
-0.052(0.01) |
117.0 |
|
Surficial Geology Types |
||||
|
Coarse-grained glacial |
151 |
-2.24 |
0.67(0.21) |
127.7 |
|
Fine-grained glacial |
151 |
-1.53 |
-1.39(0.07) |
124.9 |
|
Alluvium |
151 |
-1.85 |
0.87(0.23) |
128.1 |
|
Land Use Types & Atrazine Loading |
||||
|
% Agriculture within 3.2 km of well |
142 |
-1.72 |
0.001(0.89) |
126.4 |
|
% Forest within 3.2 km of well |
142 |
-1.19 |
-0.013(0.13) |
124.0 |
|
% Urban within 3.2 km of well |
142 |
-2.22 |
0.018(0.06) |
123.0 |
|
Agricultural atrazine loading (kg/year within 3.2 km of well) |
142 |
-1.67 |
0.001(0.89) |
126.4 |
|
Roadside atrazine loading (kg/km2-yr) |
151 |
-2.36 |
1.35(<0.01) |
120.7 |
|
Nitrate as an Indicator of Atrazine |
||||
|
Predicted probability of elevated nitrate |
142 |
-2.18 |
1.68(0.09) |
123.6 |
a Sample size varies, depending on the availability of data for each variable
Table 5. Observed and expected number of wells with water having a detectable atrazine concentration. Expected number of wells is determined from the logistic regression fit for atrazine (see Table 2). Observed and expected frequencies are also shown for wells having water with nondetectable concentrations of atrazine.
|
|
Detectable Atrazine |
Atrazine Not Detected |
||
|
Group |
Observed |
Expected |
Observed |
Expected |
|
1 |
0 |
0.03 |
15 |
15.0 |
|
2 |
0 |
0.2 |
15 |
14.8 |
|
3 |
2 |
0.5 |
13 |
14.5 |
|
4 |
1 |
1.0 |
14 |
14.0 |
|
5 |
2 |
1.5 |
13 |
13.5 |
|
6 |
1 |
2.0 |
14 |
13.0 |
|
7 |
3 |
2.3 |
12 |
12.7 |
|
8 |
2 |
2.9 |
14 |
13.1 |
|
9 |
3 |
3.4 |
12 |
11.6 |
|
10 |
8 |
8.2 |
7 |
6.8 |
Elevated Nitrate as an Indicator of Atrazine Detection
Because both fertilizers and pesticides are often applied during crop cultivation, nitrate concentrations have been used as an indicator of pesticide occurrence when pesticide data are lacking. Even though nitrate concentrations have generally been unreliable predictors of pesticide concentrations [9], the likelihood of detecting pesticides has been found to increase with increasing nitrate concentrations [10].
The probability of an elevated nitrate concentration was predicted for each well in the NAWQA data set in order to test whether these probabilities could be used as a relative measure of the likelihood of detecting atrazine. The probability of elevated nitrate was calculated by inserting the coefficient values for the appropriate nitrate model based on surficial geology (Table 2) along with well depth and land use information for each well into equation 1. The relation between the predicted probability of an elevated nitrate concentration and the detection of atrazine was positive but not significant at the 0.05 level (p=0.09, Table 4). A comparison of the relations shown in Tables 1 and 4 reveals that many of the factors affect both the predicted probability of elevated nitrate and atrazine detection in the same manner although not at the same magnitude. However, a key difference may be the effect of percent agricultural land, where nitrate had a positive coefficient and atrazine had a coefficient of essentially zero. Nitrate sources from agricultural practices in the Puget Sound Basin tend to be widespread and may therefore be described adequately by combining all agricultural land uses. In contrast, atrazine usage in this basin tends to be limited to areas where certain crops are grown. As such, nitrate models will tend to overestimate the relative risk of atrazine detection in many agricultural areas where this herbicide is used sparingly.
Conclusions
The occurrence of elevated nitrate concentrations and atrazine was related to natural and anthropogenic variables using logistic regression. Insight was gained on the possible sources of these constituents and models were developed which predict the probability of detecting atrazine or elevated nitrate. Both urban and agricultural sources of nitrate were suggested by the positive, significant relations between elevated nitrate concentrations and percent urban and agricultural land surrounding a well. Roadside application of atrazine was found to have a positive and significant relation with atrazine detection, suggesting that this is an important source of atrazine in ground water in the Puget Sound Basin.
Multiple logistic regression models were presented for both nitrate and atrazine. The predicted probability of elevated nitrate was dependent on well depth, surficial geology, and percent urban and percent agricultural land surrounding a well. The predicted probability of detecting atrazine was dependent on well depth and the amount of atrazine applied on roadsides. The utility of the atrazine model was limited by a lack of detailed source information. Using the nitrate model to assess atrazine risk is not recommended because of differences in the sources of these two constituents.
References
1 National Research Council. Ground Water Vulnerability Assessment. 1993, National Academy Press, Washington, DC.
2 Eckhardt, D.A.V., and P.E. Stackelberg. Relation of ground-water quality to land use on Long Island, New York. Ground Water, 1995. 33:p. 1019-1033.
3 Yen, S. T., S. Liu and D.W. Kolpin. Analysis of nitrate in near surface aquifers in the midcontinental United States: an application of the inverse hyperbolic sine tobit model. Water Resources Research 1996. 32:p. 3003-3011.
4 Tesoriero, A.J., and F.D. Voss. Predicting the probability of elevated nitrate concentrations in the Puget Sound Basin: implications for aquifer susceptibility and vulnerability. Ground Water 1997. 35:p. 1029-1039.
5 Hosmer, D. W., and S. Lemeshow. Applied Logistic Regression. 1989, John Wiley and Sons, New York.
6 Kolpin, D.W., J.E. Barbash and R.J. Gilliom. Occurrence of pesticides in shallow ground water of the United States: initial results from the National Water Quality Assessment Program. Environmental Science and Technology, 1998 (in press).
7 Tetra Tech. Pesticides of concern in the Puget Sound Basin: a review of contemporary usage. Prepared for the U.S. Environmental Protection Agency, 1988. Tetra Tech Report TC-3338-32, Bellevue, WA.
8 Fegeas, R.G., R.W. Claire, S.C. Guptill, K.E. Anderson, and C. A. Hallam. Land use and land cover digital data. 1983. U.S. Geological Survey Circular 895-E.
9 Barbash, J.E. and E.A. Resek. Pesticides in Ground Water. 1996, Ann Arbor Press, Chelsea, MI.
10 Szabo, Z. D.E. Rice, T. Ivahnenko and E.F. Vowinkel. Delineation of the distribution of pesticides and nitrate in an unconfined aquifer in the New Jersey coastal plain by flow-path analysis. Proceedings of the Fourth National Conference on Pesticides, Virginia Polytechnic Institute, Blacksburg, VA, 1994. p. 100-119.