
Chris Konrad
(cpkonrad@usgs.gov)
(253) 552-1634
Mark Mastin
(mcmastin@usgs.gov)
(253) 552-1609
Frank Voss
(fdvoss@usgs.gov)
(253) 552-1689
934 Broadway,
Suite 300
Tacoma, WA 98402
Methow River Basin
Scientific Topics - Surface Water
#!/usr/bin/perl -- -*-perl-*- # This script displays the navigation bar for all project pages. #---------------------------------------------------------------------------------------------------------------------- # Print html header #---------------------------------------------------------------------------------------------------------------------- print "Content-type: text/html\n\n"; #---------------------------------------------------------------------------------------------------------------------- # Retrieve query string and specify variables for links. #---------------------------------------------------------------------------------------------------------------------- $publications_link = "Publications and Products | "; $links_link = "Related Links | "; $news_link = "News Releases | "; $data_link = "Data | "; $maps_link = "Maps | "; $science_link = "Scientific Topics | "; $bibliography_link = "Bibliography | "; $status_link = "Status | "; $database_link = "Database | "; $acknowledge_link = "Acknowledgments | "; $photo_link = "Photo Gallery | "; $asses_link = "Assessment Document | "; $gis_link = "GIS and Aerial Photography Sources | "; $contact_link = "Contact Us | "; $flood_link = "Flood Hazards | "; $path = $ENV{'QUERY_STRING'}; $path =~ s/%([0-9|A-F]{2})/pack("C",hex($1))/eg; $path =~ s/[;<>\*\|'&\$!#\(\)\[\]\{\}:"\\\/]//g; $path = "../projects/".$path."/includes/".$path.".config"; #---------------------------------------------------------------------------------------------------------------------- # Open the configuration file for the specific project. #---------------------------------------------------------------------------------------------------------------------- require $path; #---------------------------------------------------------------------------------------------------------------------- # Print table head #---------------------------------------------------------------------------------------------------------------------- print qq~| Project Home | ~; #---------------------------------------------------------------------------------------------------------------------- # Determine which links to display for specific project, based on configuration file. #---------------------------------------------------------------------------------------------------------------------- while ($status > 0) { print "$status_link"; $status = 0; } while ($publications > 0) { print "$publications_link"; $publications = 0; } while ($links > 0) { print "$links_link"; $links = 0; } while ($news > 0) { print "$news_link"; $news = 0 } while ($data > 0) { print "$data_link"; $data =0; } while ($maps > 0) { print "$maps_link"; $maps = 0; } while ($science > 0) { print "$science_link"; $science = 0; } while ($bibliography > 0) { print "$bibliography_link"; $bibliography = 0; } while ($database > 0) { print "$database_link"; $database = 0; } while ($acknowledge > 0) { print "$acknowledge_link"; $acknowledge = 0; } while ($photo > 0) { print "$photo_link"; $photo = 0; } while ($asses > 0) { print "$asses_link"; $asses = 0; } while ($gis > 0) { print "$gis_link"; $gis = 0; } while ($contact > 0) { print "$contact_link"; $contact = 0; } while ($flood > 0) { print "$flood_link"; $flood = 0; } #---------------------------------------------------------------------------------------------------------------------- # Print table footer #---------------------------------------------------------------------------------------------------------------------- print qq~ Project Summaries | Partnerships | | |
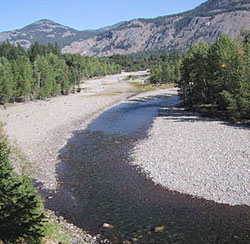 View of large meander bend on the Methow River above Wolf Creek along the Big Valley Wildlife Area. The river is about 15 meters (50 feet) wide. (Photograph taken by C.P. Konrad, U.S. Geological Survey, September 2001.)
The Methow River drains about 4,600 square kilometers (1,800 square miles) of the North Central Cascade Range. The basin spans a range of hydro-climatic conditions from the Cascade Crest at an altitude of 1,500 to 2,700 meters (5,000 to 9,000 feet), where and annual precipitation can exceed 2,000 millimeters (80 inches) and the Okanogan Highland, where annual precipitation is about 500 millimeters (20 inches) to the Columbia River valley at an altitude of 250 meters (820 feet), where annual precipitation is about 300 millimeters (12 inches). The upper regions of the basin are formed in bedrock while the valley bottom is primarily unconsolidated, alluvial, and glacial sediments. Both bedrock and the unconsolidated sediments support aquifers throughout the Methow River Basin.
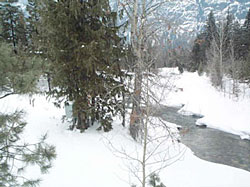 View of streamflow-gaging station no. 12447382 on Early Winters Creek. (Photograph taken by C.P. Konrad, U.S. Geological Survey, February 2001.)
Snowmelt from the higher altitudes of the Methow River Basin in spring and early summer generates most of the runoff in the basin between 44 and 71 percent of the annual runoff volume occur during May and June. Annual peak discharge also occurs during May and June. The timing of spring snowmelt is a function of both seasonal temperature changes and altitude. With low summer precipitation, high temperatures, and decreasing snow pack, streamflow generally begins to recede in July continuing through September. The periods of lowest flow are mid-winter (December to February) and early autumn (September) when streamflow is primarily a result of ground-water discharge, supplemented to a limited extent by snowmelt and storm runoff. During these periods, surface flow ceases in some headwater streams and along reaches of rivers where streamflow is lost to ground water.
The U.S. Geological Survey (USGS) has been collecting streamflow data in the Methow River Basin since the early 20th century. The USGS operates a network of 15 continuous streamflow-gaging stations in the Methow River Basin including eight "real-time" stations that transmit current streamflow information to the USGS's web-accessible database, the National Water Information System.
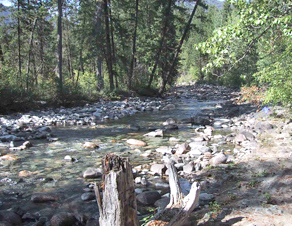 View of headwaters of the Methow River above Lost River in the Okanogan National Forest. (Photograph taken by C.P. Konrad, U.S. Geological Survey, September 2001.)
The streamflow-gaging network encompasses the primary tributaries of the Methow River as well as its mainstem. The smallest gaged tributary is Andrews Creek with a mean discharge of 0.9 cubic meter per second (32 cubic feet per second). Andrews Creek Basin in the Pasayten Wilderness of the Okanogan National Forest is about 56 square kilometers (22 square miles). The streamflow-gaging station serves as one of the Nation's hydrologic benchmark stations, which provides information on streamflow from basins with limited human influences. The streamflow record for the Methow River gaging station at Twisp dates back to 1919. Discharge for the largest flood of record, 1,155 cubic meters per second (40,800 cubic feet per second) on May 29, 1948, was estimated based on data from this gaging station. The farthest downstream gaging station is near Pateros, about 11 kilometers (7 miles) from the confluence of the Methow and Columbia Rivers. The USGS has operated the gage continuously since 1959. The mean discharge of the Methow River at the gaging station near Pateros is 45 cubic meters per second (1,577 cubic feet per second), which is equivalent to about 300 millimeters (12 inches) of runoff from the entire basin in a year.
The USGS has developed a hydrologic simulation model to assess the effects of irrigation on streamflow in the Methow River and its tributaries. The first phase of this project was to reconstruct streamflow at various points in the basin as if there were no water diverted for irrigation. In the second phase of this project, the USGS will add irrigation diversions to the model, thus providing a publicly available water-resources management tool for the basin.