
Any use of trade, firm, or product names is for descriptive purposes only and does not imply endorsement by the U.S. Government.
Suspended-Sediment Concentrations during Dam Decommissioning in the Elwha River, Washington
Prepared in cooperation with the U.S. Environmental Protection Agency and the National Park Service
By Christopher A. Curran, Christopher S. Magirl, and Jeffrey J. Duda
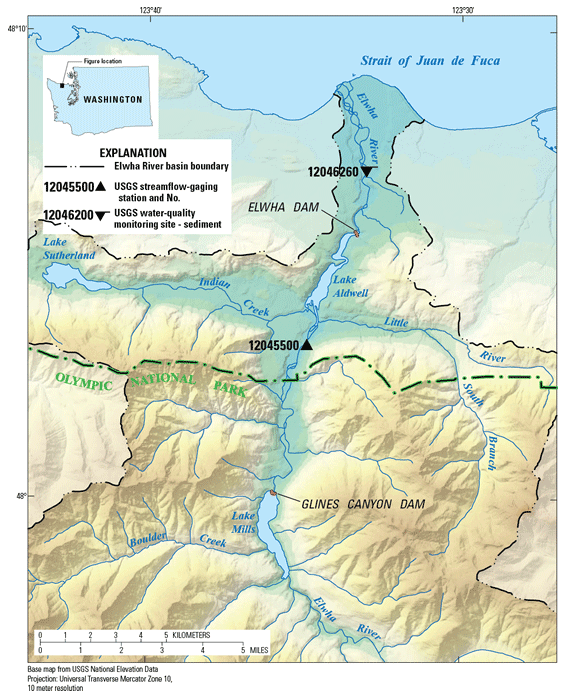
Figure 1. Map of Elwha River in northwestern Washington showing water-quality monitoring station 12046260, Elwha River at Diversion, near Port Angeles, where turbidity and suspended-sediment concentrations were measured, and streamflow-gaging station 12045500, Elwha River at McDonald Bridge, near Port Angeles, where continuous water discharge was recorded.
(High resolution, PDF 280 KB)
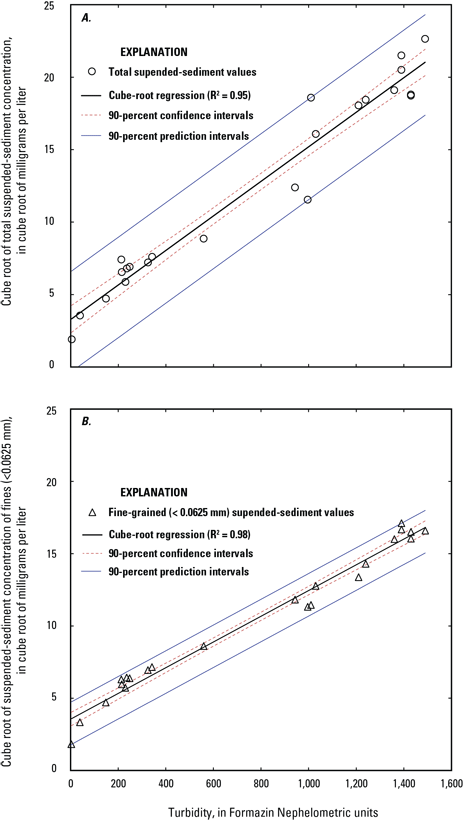
Figure 2. Graphs showing least-squares regression model used to estimate (A) total suspended-sediment concentrations, and (B) fine suspended-sediment concentration from turbidity at U.S. Geological Survey water-quality monitoring station, Elwha River at Diversion, near Port Angeles (12046260).
(High resolution, PDF 330 KB)
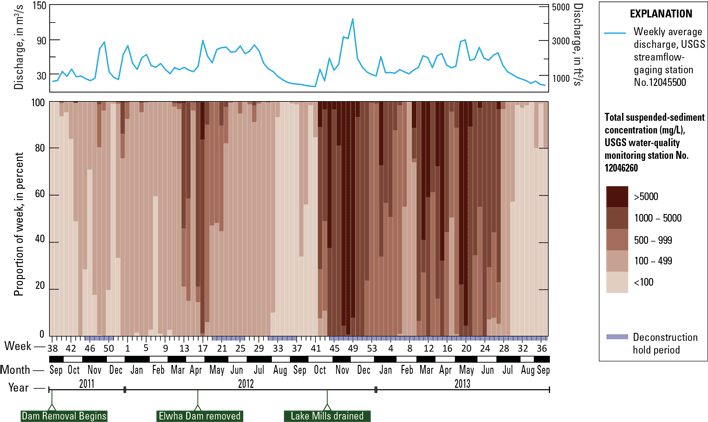
Figure 3. Graph showing suspended-sediment concentration bins as a proportion of each week (based on a maximum of 672 15-minute turbidity samples per week) from September 2011 to September 2013 at U.S. Geological Survey water-quality monitoring station Elwha River at Diversion, near Port Angeles (12046260). At top, a corresponding hydrograph of weekly average discharge 8 km upstream at U.S. Geological Survey streamflow-gaging station Elwha River at McDonald Bridge, near Port Angeles (12045500).
(High resolution, PDF 265 KB)